Predicting E-Commerce Seller Performance

Exploratory data analysis and seller performance prediction leveraging a sample of e-commerce data from Brazilian company Olist.
Read the full code on Github here
E-Commerce Seller Performance Prediction
Deployed Model
Summary
We take on a role of a team of data scientists at Olist, an online e-commerce company that connects small businesses from all over Brazil to large online e-commerce marketplaces such as Mercado Livre and Americanas.
By listing their products on Olist Store, small business owners are able to sell their products to customers on these marketplaces without the prohibitive costs of maintaining a vendor presence there.
The project focused on how we can use sample e-commerce data to increase the number of sellers and provide recommendations to them.
The final model predicts seller performance based on seller and product features, where the decision tree-based Random Forest algorithm was leveraged.
Translation, word tokenization and topic modeling was also performed on the dataset of Portuguese reviews.
Problem Statement
Based on the data we’ve gathered from the sales and reviews on the platform, we have been tasked to estimate the sales that a seller can get based on factors such as their product category, average product price and location.
Additionally, we also want to take a look at the reviews to give potential sellers advice on how to increase customer satisfaction.
Our guiding questions are:
- How much can a seller expect to earn on the platform?
- What steps can a seller take to increase their sales?
- What are the prominent topics that feature in our customer reviews?
Approach
1. Data Processing and Cleaning
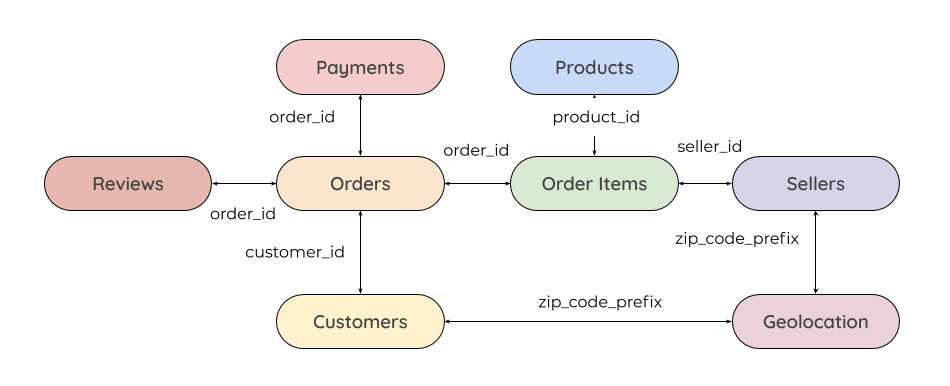
The data was cleaned and processed before analysis could take place. Our data was provided to us in eight separate datasets.

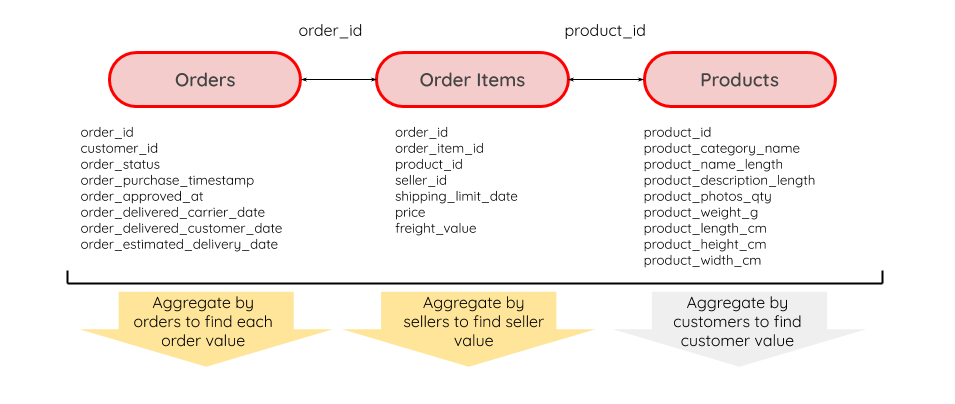
These datasets needed to be joined along unique customer, order and seller ids to create a master order list that could be aggregated.

The processing included removing orders that were cancelled or had ambiguous order statuses, as well as feature engineering to create variables for delivery time and difference in delivery estimates.
The full approach is outlined in the code notebooks on Github.
2. Key Insights and Visualisations
The product categories which generated the highest sales value tended to be those with the highest sales in general (health and beauty, bed bath and table, sports leisure). However, we also see the watches_gifts category perform well in sales value although being seventh in terms of sales count.
The mean sale prices, total sale orders, total sales value and number of unique products per category have been combined in the interactive plot here:
By joining our order and seller data with our location data, we were also able to see the areas with the highest order values, where we see that most orders come from the southeastern coast, concentrated in Sao Paulo and Rio, two of Brazil’s largest cities.
This trend was also reflected in the number of sellers and seller performance in these areas.
This provided us indication that the location and product categories would have an impact on the sales generated by sellers.
3. Modeling Approach & Results
As the variables are unlikely to be related linearly to the target variable of average sales per month, we focused largely on the Random Forest algorithim and Gradient Booster. The data was split into training and validation sets, where both algorithms were tuned using gridsearch and evaluated on root mean squared error.
The final model selected was based on the Random Forest, which had a slightly higher RMSE but was giving realistic results as the Gradient Booster was returning negative values, which would not be fruitful for our use case.

We were able to build a predictive model for predicting seller performance with around R$200 of root mean squared error and an adjusted R2 score of 0.93. However, as the data is not completely comprehensive, the model will require additional training on more data to be sufficiently robust and to evaluate its reproducibility.
The model predicts seller performances by taking in the following information:
- Product Category
- State
- Min, Max, Average Product Price
- Number of Products they can sell in a month
- Number of Unique Products
Average products they can sell in a month turned out to be the most predictive factor, along with the minimum, maximum and average product prices. When removing this feature, our accuracy dropped to about 0.5.
In a real-world context, we would want to consider other features that are associated with each seller, such as the size of their company, length of seller relationship to Olist and activity on the platform.
The web app based on the final model is deployed on Heroku.
Conclusion and Insights
To recap our guiding questions:
- How much can a seller expect to earn on the platform?
- What steps can a seller take to increase their sales?
- What are the prominent topics that feature in our customer reviews?
Leveraging our seller characteristics, we were able to build a model to predict seller performance on the platform. This could be useful in the long run for our marketing team to get leads, but is also useful for the Olist team in determining the value of a potential seller on the platform.
In terms of increasing sales, sellers may also want to consider:
- Expanding into the top grossing product categories such as watches gifts
- Expanding their inventory of products and list additional products
Data Limitations
Sales Data
As this is a sample of the data, more accurate observations and predictions can be obtained if we are able to access a more comprehensive set of data, for example all of the data for selected sellers across a 6 month period. This will also allow us to make time-based predictions by splitting the data across months and improve the model.
Reviews Data
With a larger corpus of data, we may be able to identify more salient topics, as the ones we have managed to find here give us an idea of the potential of topic modeling for reviews.
As this is a sample of data taken on orders where we have review data, it may be fruitful for us as well to investigate our orders where we have no reviews, and why, so we can identify ways to get customers to give us more feedback.
Future Extensions
With more time and more data, it would be interesting to explore:
Predicting Sales Volume
Flipping the problem around, we can try to predict the optimal sales volume for customers to sell their product at for both Olist and the seller to maximise our returns.
Additional Factors
If we have access to more data, we can incorporate additional information such as seasonal variables, seller relationship length, additional seller characteristics (size of company, frequency of updates of catalog etc.).
We can also further refine our data by clustering our locations and categories.
Customer Lifetime Value
Due to a lack of sufficient repeat customer data, we could not examine the data from a customer point of view, but it will also be interesting to look at CLV, especially if we can consider the platforms and marketplaces on which the customers are buying from us.
Read the full code on Github here